머신러닝 - 결정 트리(Decision) 쉽게 이해하고 구현하기
Decision Tree 알고리즘 이란 무엇인가?
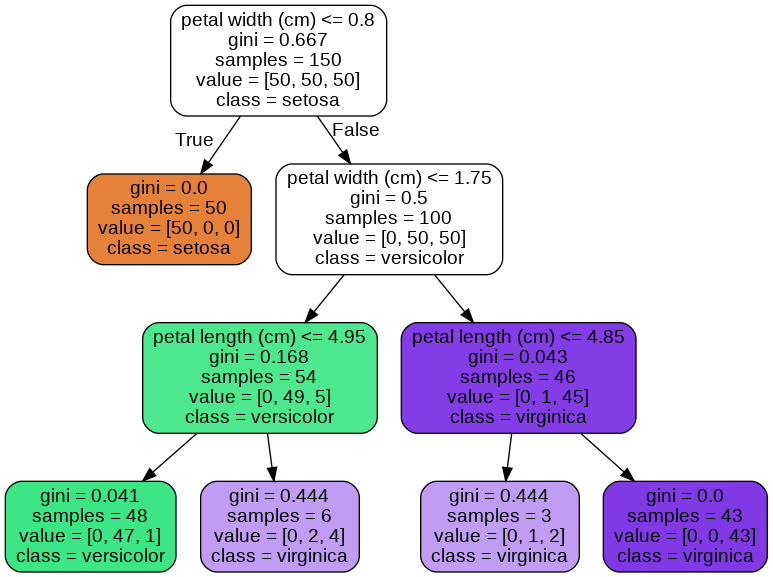
의사결정나무(decision tree): 주어진 입력값들의 조합에 대한 의사결정규칙(rule)에 따라 출력값을 예측하는 모형으로 트리구조의 그래프로 표현

-
gini : 불순도 점수
-
Sample : 노드에 속하는 샘플의 수
-
Value : 클래스별 샘플의 수
-
class: 예측 클래스
-
불순도가 감소하도록 노드를 분할하는 알고리즘
-
현재 노드의 불순도에 비해 자식노드의 불순도가 감소되도록 분기의 기준을 설정
-
변수 중요도를 측정 가능
-
정규화가 필요하지 않음
과적합 문제 발생
해결법 : 결정트리를 규제하기 위한 주요 파라미터 조정
- Max_depth : 트리의 깊이를 제한
-
데이터 개수가 min_samples_split보다 작아질 때 까지 계속 분할
-
깊이가 깊어지면 min_samples_split 설정대로 최대 분할하여 과적합할 수 있으므로 적당한 값으로 제어
- Min_sample_split : 분기를 하기 위한 최소한의 샘플수
- 작게 설정할수록 분할되는 노드가 많아져 과적합 가능성 증가
- Min_sample_leaf: 리프 노드 가지고 있어야 할 최소한의 샘플수
- 비대칭적 데이터의 경우 특정 클래스의 데이터가 극도로 작을 수 있어 이 경우에는 작게 설정
- Max_leaf_nodes: 리프 노드의 최대수
import numpy as np
import pandas as pd
import matplotlib.pyplot as plt
import seaborn as sns
데이터 준비
from sklearn.model_selection import train_test_split

def get_iris():
    df = sns.load_dataset('iris')

    # 라벨 인코딩
    df['species'] = df['species'].map({
        'setosa': 0,
        'versicolor': 1,
        'virginica': 2
    })

    # 특성과 라벨 분리
    X, y = df.drop('species', axis=1), df['species']

    return train_test_split(X, y, test_size=0.2, random_state=2022) # train, test 분리
X_train, X_test, y_train, y_test = get_iris()
모델 학습 (DecisionTree)
from sklearn.tree import DecisionTreeClassifier

clf = DecisionTreeClassifier(random_state=2022)
clf.fit(X_train, y_train)
clf.score(X_train, y_train)
1.0
파라미터 조정 (GridSearch)
from sklearn.model_selection import GridSearchCV

params = {
    'max_depth': range(1, 10),
    'min_samples_leaf': range(1, 10),
    'min_samples_split': range(3, 10)
}

clf = DecisionTreeClassifier(random_state=2022)
cv = GridSearchCV(clf, params, cv=3)
cv.fit(X_train, y_train)
cv.best_score_, cv.best_params_
(0.9666666666666667,
 {'max_depth': 2, 'min_samples_leaf': 1, 'min_samples_split': 3})
clf = cv.best_estimator_
clf.fit(X_train, y_train)
DecisionTreeClassifier(max_depth=2, min_samples_split=3, random_state=2022)In a Jupyter environment, please rerun this cell to show the HTML representation or trust the notebook.
On GitHub, the HTML representation is unable to render, please try loading this page with nbviewer.org.
DecisionTreeClassifier(max_depth=2, min_samples_split=3, random_state=2022)
트리 시각화
from sklearn.tree import plot_tree

plot_tree(clf)
plt.show()
댓글남기기